Comments:
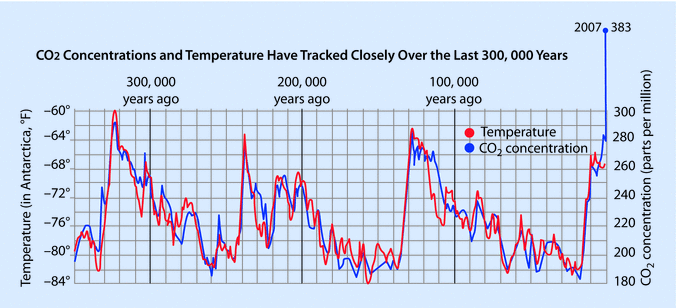
- 350,000 year CO2/Temp record from ice cores
- notice CO2/temp correlation occurs pretty well throughout the period up to about 200 years ago
- Upswings:
- peak at about years -320,000, -240,000, -130,000, -10,000
- upswings are relatively quick (about 10,000 years) and relatively linear
- driven by double feedback
- CO2 raises temp, warming oceans
- warmer oceans release more dissolved CO2, raises CO2 level
- in all of upswing on the chart, the upswing stops as remaining dissolved CO2 in ocean approaches zero
- current temp upswing (just beginning, not shown on chart) will not stop for that reason, because we have added so much CO2
- Downswings:
- slower, more complex process
- ice has melted, trees grow, absorbing C from CO2. reducing CO2
- less CO2 lowers temperature
- eventually, ice reforms, kills trees, streams carry decay to ocean
- decay yeilds CO2 in ocean, ready for new upswing
- Human using agricuture occurs at about -10,000 years:
- ENTIRE human mass agricuture period between last 2 vertical lines on graph
- starts at the peak of last upswing
- we have no human experience w/agriculture DEPENDENCE outside of about a 2 degree F span
- CO2 first exceeded 300ppm about 100 years ago. It is now above 410ppm
- This puts CO2-temp correlation WAY OUT OF WHACK, relative to any other period on this chart
- From feedback activity on upswings in this chart, we know that temp can raise CO2 to get chart back in sync (until the ocean runs out of dissolved CO2), and CO2 CAN RAISE TEMP to get the chart back in sync
- On this chart, 100ppm change in CO2 corresponds to about 20 degrees F change in temperature
- At that rate, the temp change required to bring temp into correlation with CO2 level of 410ppm would be:
- (410ppm-260ppm)*(20 degrees F/100ppm)=30 degrees F temp rise, relative to start of human agriculture period
- 30 degree F temp rise is clearly a DISASTER for humanity
- The above analysis is a somewhat pessimistic, because Temp and CO2 should probably be graphed on a logarithmic scale, rather than a linear scale. But from the chart, we have direct HISTORICAL data that correlates 290ppm with an 8 degree F temp rise, and 410ppm is clearly worse than that. 8 degree F temp rise also spells a clear DISASTER.
--- but, it takes time to bring temp up to match CO2 concentration. Recall upswings on chart took 10,000 year. We are only 100 year into the "above 300ppm" condition. So measuring today temp doesn't reflect where temperature is ultimately headed, simply as a result of the CO2 that is ALREADY UP THERE (and which will stay there). (Also, it isn't going to take anywhere near 10,000 years to get major effects of current CO2 - temp miscorrelation -- the process will be accelerated because the degree of mis-correlation is so extreme.)